
A robust Chart of Accounts serves as the fundamental framework for any accounting system, dictating the classification, aggregation, and presentation of financial transactions within financial statements. Inadequate or antiquated COA designs can lead to erroneous reporting, reduced operational efficiency, and challenges in conducting financial analysis.
Streamlining the Chart of Accounts facilitates the systematic organization of financial data, thereby enhancing reporting precision, accelerating decision-making processes, and improving the efficacy of financial oversight.
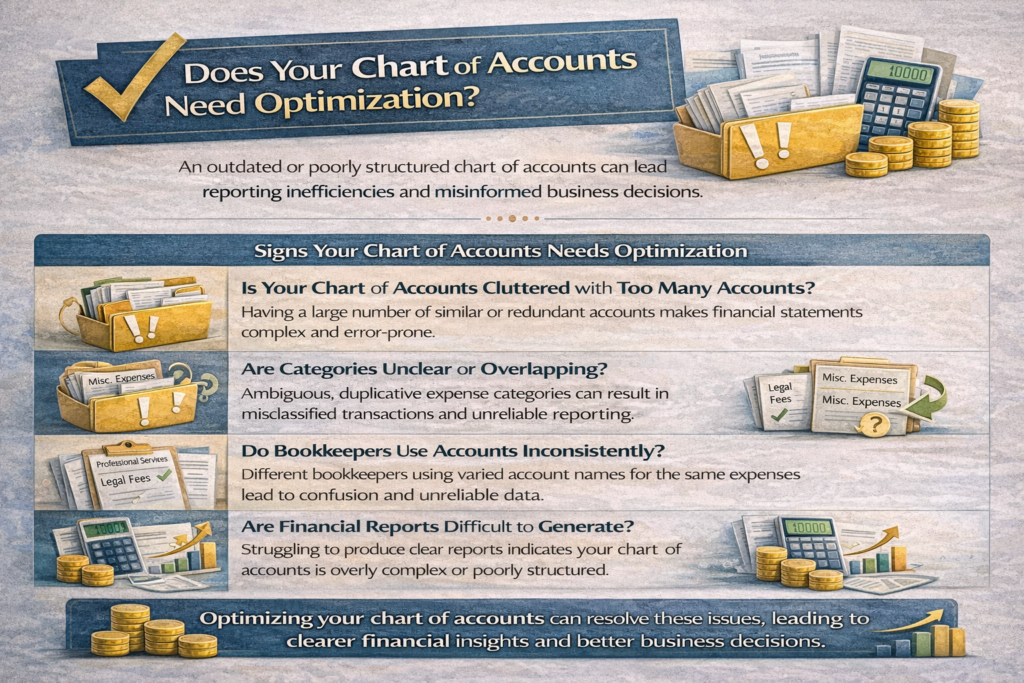
Why Chart of Accounts Optimization Becomes Necessary
Small companies often begin with a basic chart of accounts, but as they grow, adding accounts haphazardly leads to complexity and confusion.
Common issues that signal the need for COA optimization include:
- Number of accounts are excessive
- Descriptions of accounts are unclear
- Duplicate expense categories
- Inconsistent account usage
Optimization ensures that the accounting structure matches the company’s operational reality.
The Relationship Between COA Design and Financial Reporting Accuracy
A well-designed Chart of Accounts is crucial for accurate financial reporting. Poorly structured accounts can lead to transaction misrecording and skewed financial outcomes, such as inaccurate profit margins from misclassified expenses or an inaccurate balance sheet from incorrect asset categorization.
An optimized chart of accounts ensures that:
- Financial data is properly categorized
- Reports are easier to interpret
- Financial analysis becomes more reliable
Ultimately, the quality of financial reporting depends heavily on the quality of the COA structure.
Key Principles of an Optimized Chart of Accounts
A well designed chart of accounts follows several fundamental principles that support both operational efficiency and financial transparency.
Essential Design Principles
| Principle | Explanation |
| Simplicity | Avoid unnecessary or duplicate accounts |
| Consistency | Use standardized naming conventions |
| Scalability | Allow room for future business expansion |
| Logical Grouping | Organize accounts by financial category |
| Reporting Alignment | Ensure accounts support financial reporting needs |
These principles help create a COA that is both efficient and adaptable.
The Impact of COA Optimization on Business Decision Making
Financial reports are only useful if they provide clear insights into business performance.
Optimized account structures allow businesses are as follows:
- Analyze cost behavior
- Track department level performance
- Compare financial results across periods
- Financial forecasts generate more accurate data
This improves the quality of strategic decision-making.
Relationship Between COA Structure and Financial Reporting
Financial reporting quality heavily depends on how accounts are structured.
For example:
- Sales performance is gauged by revenue accounts.
- Expense classifications influence profitability analysis
- Asset accounts affect balance sheet accuracy
An optimized COA ensures that every transaction flows logically into financial statements, reducing the need for manual adjustments.
Industry-Specific Chart of Accounts Design
Different industries require different account structures to reflect their operational characteristics.
For example:
Manufacturers track inventory; service firms track labor and project costs.
Example-1
| Industry | Typical COA Focus |
| Manufacturing | Inventory, production costs |
| Retail | Cost of goods sold, sales categories |
| Professional Services | Labor, project expenses |
| Technology Companies | R&D expenses, subscription revenue |
Tailoring the COA to industry requirements improves reporting clarity.
Retailers need a Chart of Accounts optimized for inventory, sales, and COGS, differing from service businesses by requiring close monitoring of stock, supplier costs, and product margins.
Example 2:
Typical Retail Chart of Accounts Structure
| Account Category | Example Accounts | Purpose |
| Assets | Cash, Bank Account, Inventory, Store Equipment | Manages inventory and asset data. |
| Liabilities | Accounts Payable, Credit Card Payable | Records supplier obligations |
| Revenue | Product Sales, Online Sales Revenue, Discount Sales | Tracks income from different sales channels |
| Cost of Goods Sold (COGS) | Purchase Cost, Freight-In, Inventory Shrinkage | Measures the direct cost of products sold |
| Operating Expenses | Store Rent, Advertising exp etc. | Operational costs are tracked daily |
Practical Example of COA Simplification
Before Optimization
Office Supplies
Office Stationery
Office Expenses – Supplies
Office Materials
After Optimization
Office Supplies Expense
Consolidating categories simplifies accounting system maintenance and analysis.
Conclusion
Optimizing the Chart of Accounts is key for accurate financial reporting. Simplified, standardized, and business-aligned structures improve financial performance visibility. A good COA boosts reporting efficiency, strengthens controls, aids decision-making, and supports growth.
Reference:
Kieso, Donald E., Jerry J. Weygandt, and Terry D. Warfield – Intermediate Accounting (Widely used accounting textbook explaining financial reporting structures including the Chart of Accounts.)